Check the XAU/USD chart
Trade idea:
SELL at 1219.75; TP1 1217.15; TP2 1213.40; SL1223.
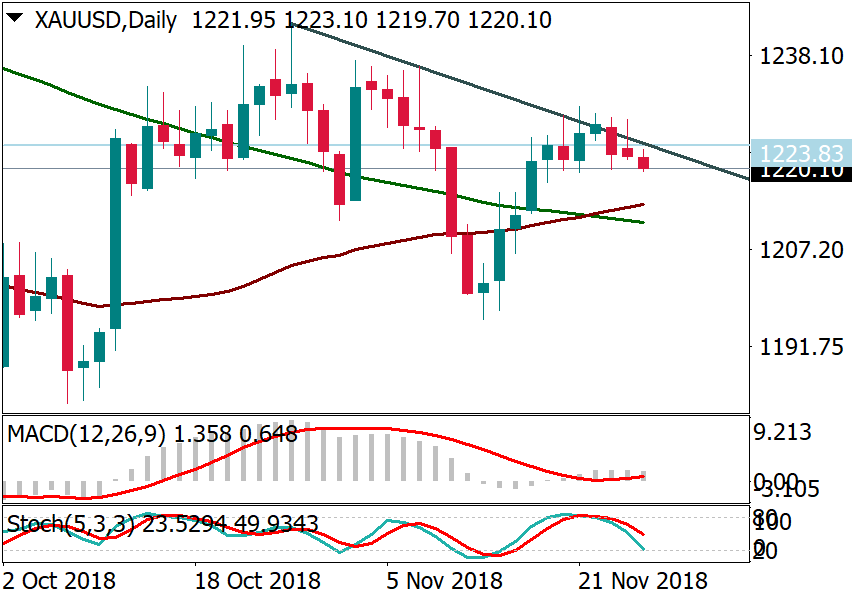
Gold formed a candlestick with a longer upper shadow on D1. Daily Stochastic and MACD are going down. These are minor bearish signs that may lead to a short-term decline. The precious metal can return to the support of the daily moving averages in the 1215 area.

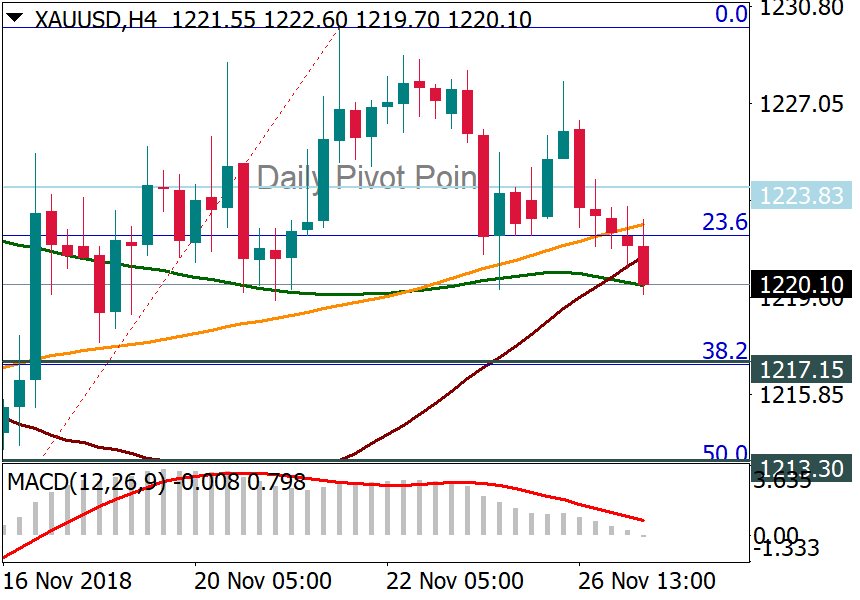
On H4, XAU/USD is probing down support of the MAs. If this support breaks, the targets will switch to 38.2% and 50% Fibo retracement levels of the Nov. 13-21 advance.
