The Ichimoku indicator performs several important tasks. It:
Marks the direction of the dominant trend.
Shows the momentum and strength of the trend.
Provides reliable support and resistance levels.
Gives trade signals.
This indicator may look intimidating at first, but once you know it, you will find it both simple and invaluable in market analysis.
In this tutorial, we will tell you about the elements of Ichimoku and the signals they produce. We will explain how to use this technical tool to analyze the market.
The elements of Ichimoku
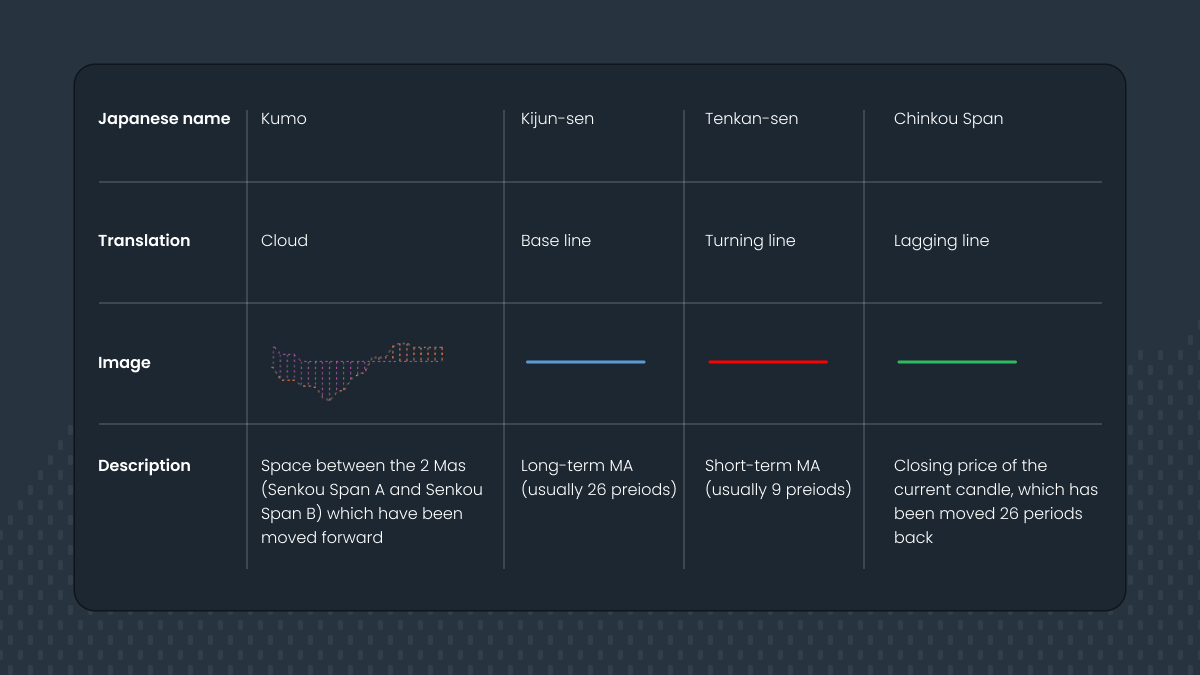
The indicator is based on moving averages, some of which have modifications. Its lines have traditional Japanese names as well as conventional modern ones.
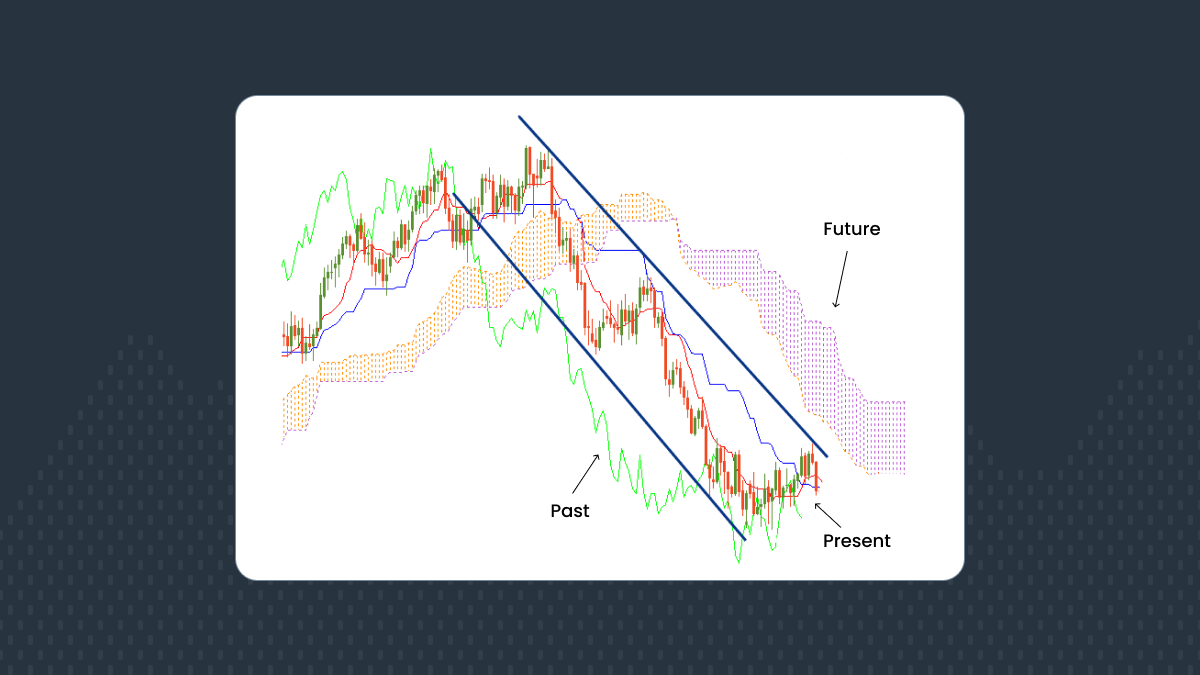
Have a look at the example of the Ichimoku indicator on the chart. We can distinguish the 3 layers — past, present, and future.
The 'Present' on the Ichimoku indicator
Let’s start with the present. It’s characterized by 2 lines — Kijun and Tenkan. Kijun (the base line) is a moving average with a bigger period. It measures medium-term momentum and has more weight than the Tenkan. The price crosses the Tenkan more often than the Kijun; if the price does cross the Kijun, it signals changes in the market.
The 'Future'
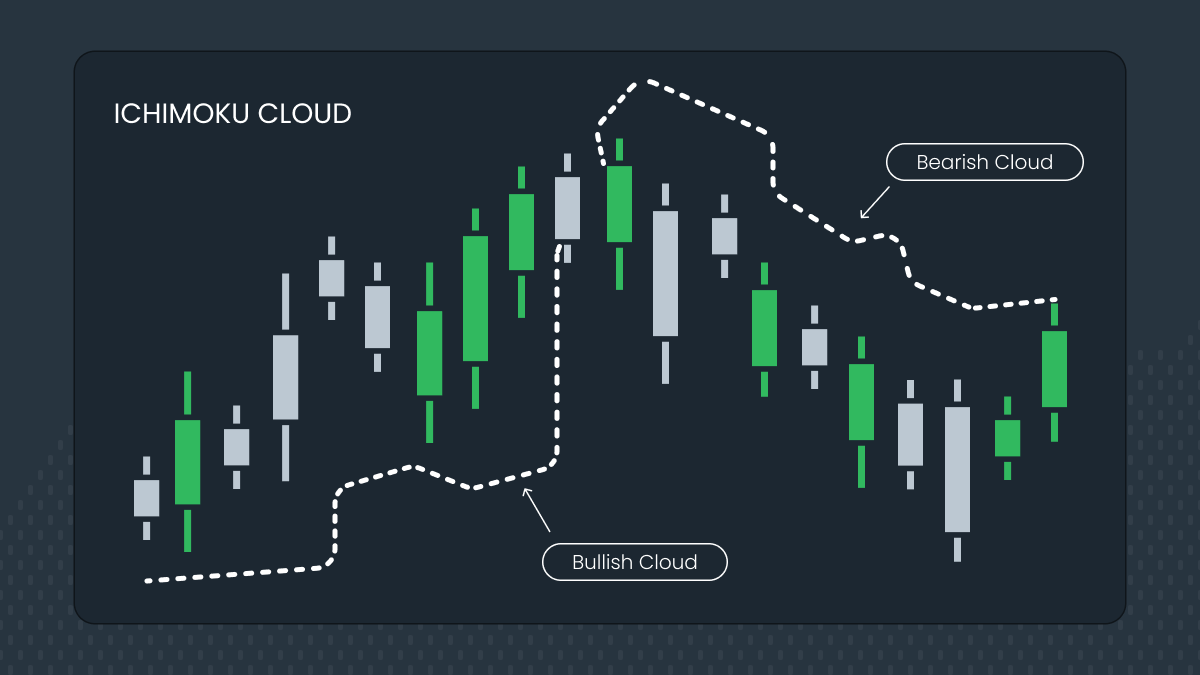
The future is represented by the Ichimoku cloud. The cloud is formed by the 2 moving averages, which are shifted forward. If the moving average with the bigger period (Senkou Span B) is below the moving average with a smaller period (Senkou Span A), the cloud is considered bullish. Its color is usually light. If Senkou Span B is above Senkou Span A, the cloud is considered bearish. Bearish clouds often have a darker color. A bullish cloud means that buyers are dominating the market, and bearish clouds show that sellers are in control. You can see that the cloud changes color from time to time reflecting the shifts of power from bulls to bears, and back. The width of the cloud matters: the wider the bearish cloud, the stronger the sellers. To understand the current power balance of the market, look at the part of the cloud that is in the future, i.e. to the right of the current price. The part of the cloud that is aligned with the current prices acts as support and resistance for the price.
The 'Past'
In the past, there’s a single line called the Chinkou Span. Unlike the other Ichimoku lines, it’s not a moving average, but simply a price chart moved a number of periods back so that it lags behind the market. The way this line interacts with the price chart itself offers hints for traders.
Why are some elements of the indicator switched forward while some are placed backward? Firstly, it would be very difficult to read the chart if all 5 lines were in the same area. In addition, this way the elements of the Ichimoku indicator produce trade signals. Next, we will show you how to interpret these signals.
How to implement the Ichimoku
To apply the Ichimoku to a chart in MetaTrader, click Insert, choose Indicators, and pick Custom, then Ichimoku. In the settings, you can choose values for the Tenkan, Kijun and Senkou Span B. You can also adjust the colors of the indicator’s lines according to your preferences.
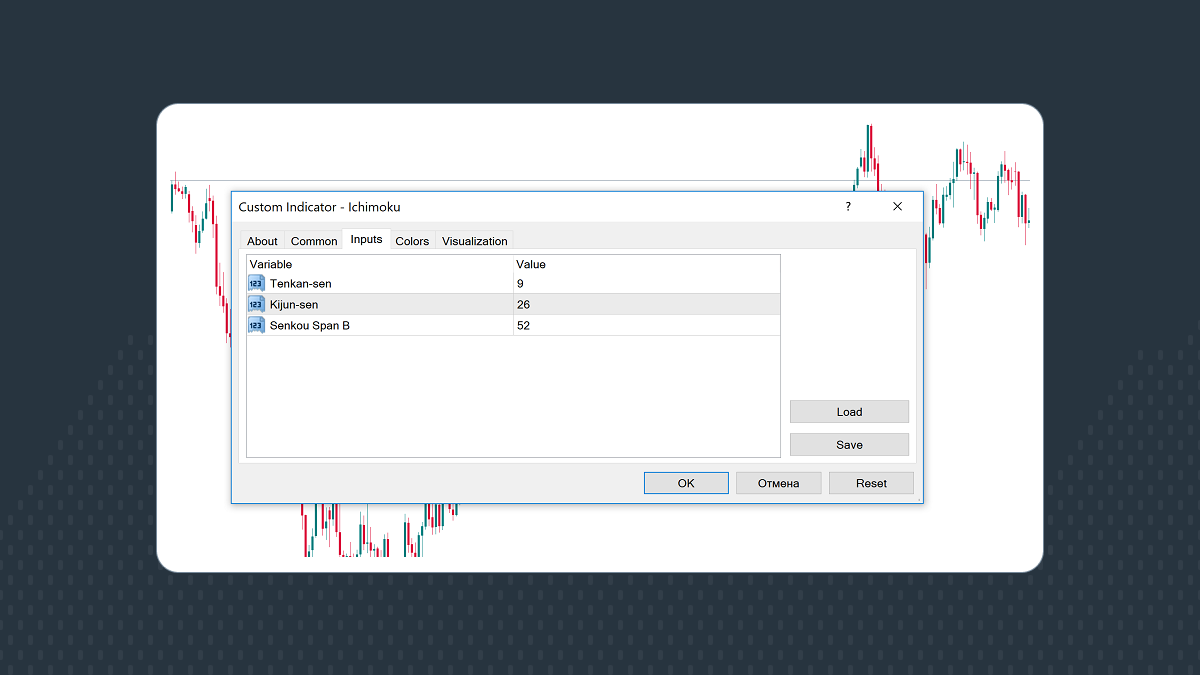
The default settings 9-26-52 are the original parameters proposed by the indicator’s developer. They are popular among traders and can be used on any timeframe. You are also free to adjust the default settings. The key thing is to choose increasing values so that the figure for Tenkan-sen is the smallest and the value for Senkou Span B is the biggest.
Trading with the Ichimoku
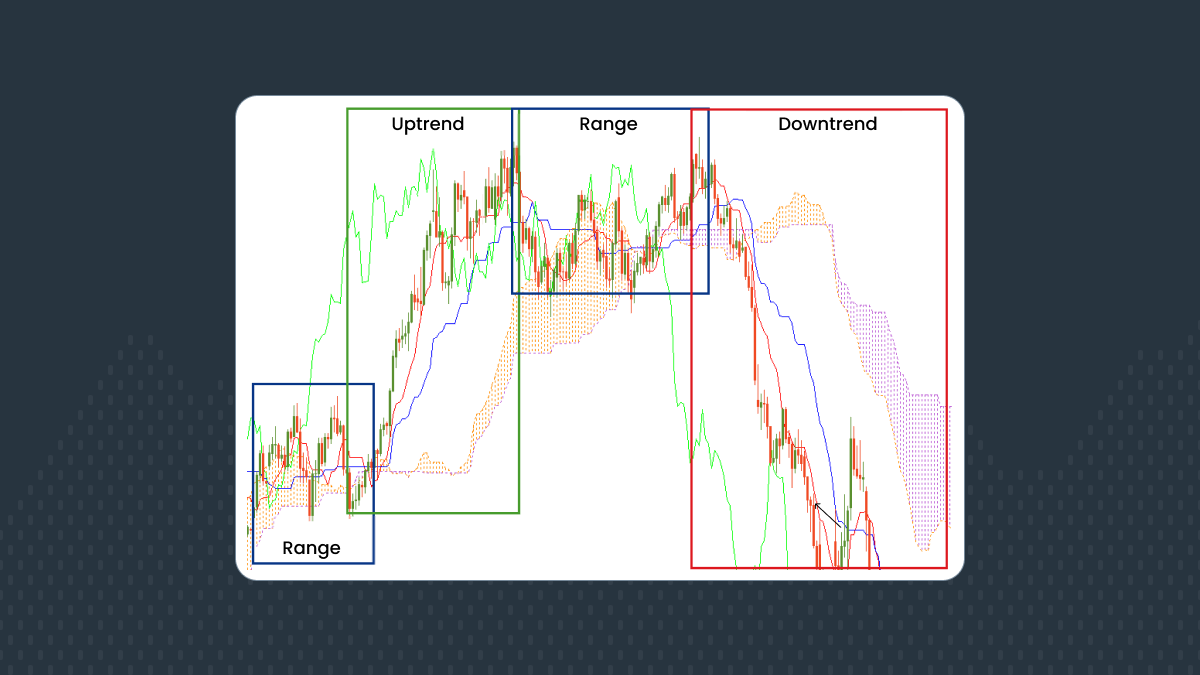
The position of Ichimoku lines can give traders a clear view of the existing trends. When the market is sideways, the indicator lines are horizontal so that the price is fluctuating around them. The cloud is thin and changes its color often.
If the price is above the cloud Tenkan and Kijun, and the bullish cloud is solid, it’s an uptrend. The Chinkou Span will be above the price in this case.
If the price is below the cloud Tenkan and Kijun and the bearish cloud is solid, it’s a downtrend. The Chinkou Span will be below the price in this case.
The Ichimoku lines produce trade signals by crossing each other and the price. That’s why there are many different signals in the table below. Notice that when a new trend starts, signals from different elements of the indicator tend to appear around the same time and point in one direction.

Ichimoku trading signals
Let’s review an example of how Ichimoku provides trade signals.
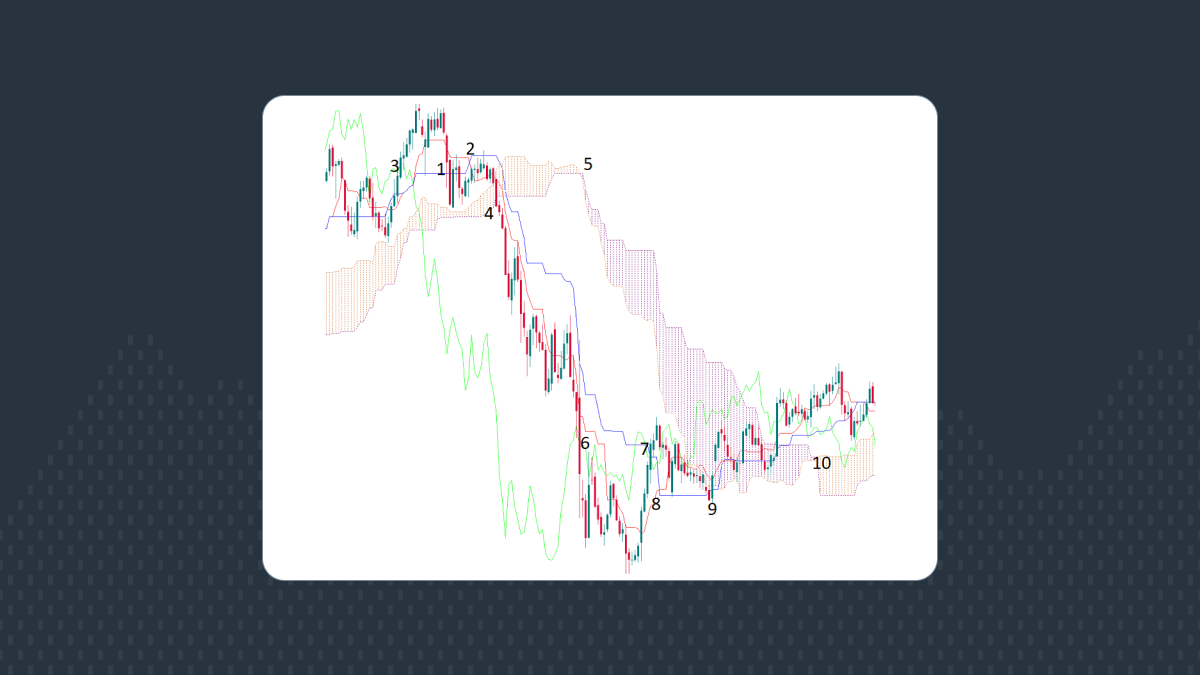
1 - The price went below Kijun-sen. It’s the first bearish signal.
2 - Tenkan-sen fell below Kijin-sen.
3 - Chinkou Span crossed the price chart to the downside.
4 - Price broke below the Ichimoku cloud.
5 - The cloud switched from bullish to bearish.
Signals 2-4 appeared around the same time and signaled the start of a bearish trend. They point to the opportunity to open a sell trade. The lines of the indicator then acted as resistance for the price.
6 - Chinkou Span broke back above the price chart. It’s possible to take profit from a short position.
7 - Price went above Kijun-sen.
8 - Tenkan-sen went above Kijun-sen.
9 - The thick bearish Ichimoku cloud acted as resistance for the price but it finally managed to break in.
10 - The cloud switched from bearish to bullish. The price went above the cloud. There are indications of an emerging uptrend, although, given the fact that Chinkou Span corrected to the price chart, there may also be a sideways trend for some time.
Summary
The Ichimoku indicator represents a complete trading system. It’s possible to use just this indicator for trading. You can use it to identify trends, check for support and resistance levels, and get entry signals. You can customize the indicator’s settings and use it together with other tools of technical analysis.