When it comes to trading, knowing how to spot technical patterns can play a big role in your decision making. The Head and Shoulders pattern is one of the most trusted signals for spotting trend reversals.
This guide will walk you through how the pattern works, how to use it to your benefit, and how to avoid common mistakes. Whether you’re a novice trader or a seasoned expert, learning this pattern can sharpen your strategy and bring some clarity when entering the market.
What is the Head and Shoulders pattern?
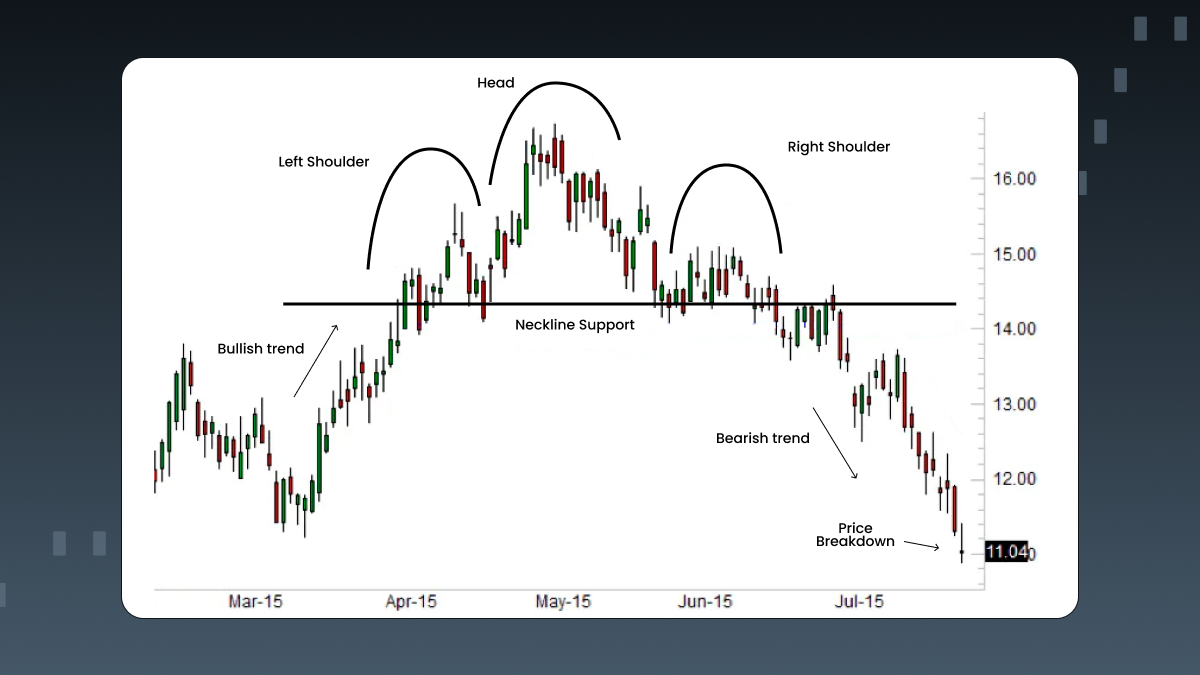
The Head and Shoulders pattern is a reversal chart pattern that signals a potential shift from an uptrend (bullish) to a downtrend (bearish). It consists of three distinct parts:
Left shoulder: The price rises, forms a peak, and then declines.
Head: The price rises again, this time reaching a higher peak before declining.
Right shoulder: The price makes one final upward move, but this time it forms a lower peak compared to the head.
The peaks in this pattern are connected by something called a neckline, which works as a support level. You create the neckline by drawing a line through the lows between the left and right shoulders. When the price drops below this neckline, it confirms the pattern, often leading to a steady downward trend.
This pattern is pretty popular because it has a high chance of signaling when a trend is about to reverse. It’s not foolproof, but it gives traders a heads-up to either exit their long positions or consider short trades. Spotting and confirming the pattern correctly can improve your chances of making the right move.
The Inverse Head and Shoulders pattern
Just as markets fall, they also rise. The Inverse Head and Shoulders pattern is the bullish counterpart of the standard pattern. Instead of peaks, it consists of valleys:
Left shoulder: The price falls, reaches a low, and recovers slightly.
Head: A deeper low forms before recovering again.
Right shoulder: A higher low than the head that shows waning bearish momentum.
The neckline in this scenario works as a resistance level, connecting the peaks of the valleys. When the price breaks above this neckline, it usually points to a potential bullish trend reversal.
This pattern is a great tool for spotting when a market might shift from a downtrend to an uptrend. It gives traders an opportunity to enter long positions before the market starts gaining upward momentum.
Is it always reliable?
This approach often delivers solid results, but it’s wise to stay careful. The market can sometimes give false signals, causing you to enter or exit a trade too soon. Pairing this strategy with other tools, like volume trends or moving averages, can make it more dependable.
How is the Head and Shoulders pattern formed?
Recognizing how this pattern forms is key to spotting it on a chart. Here’s how both the standard and inverse versions are formed:
The stages of formation
Left shoulder: The price trends upward and then corrects downwards. For the inverse pattern, the price trends downward before bouncing upward.
Head: A stronger rally (or decline in the inverse version) follows, forming the highest (or lowest) point in the pattern.
Right shoulder: A less aggressive upward (or downward) move occurs but fails to match the head’s height (or depth). This often indicates declining momentum.
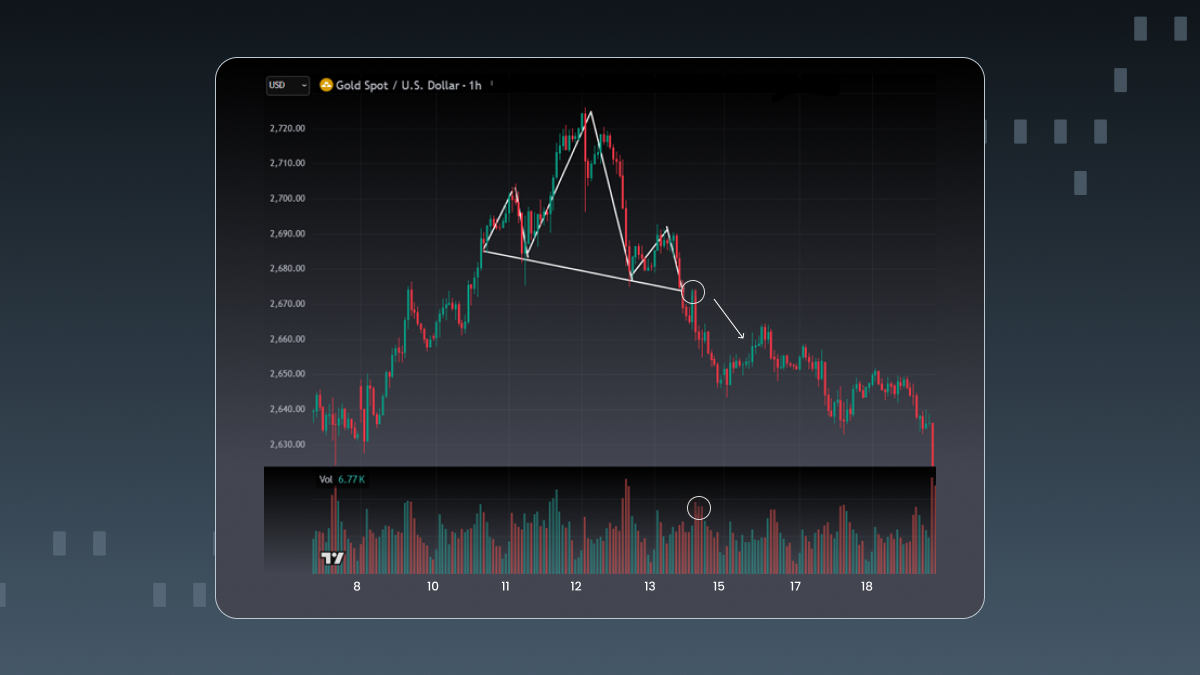
Neckline formation: The lows (or highs in the inverse pattern) between the shoulders are connected to form the neckline.
Breakout: The pattern completes when the price breaks the neckline, confirming the reversal. A breakout accompanied by volume usually solidifies reliability.
Pro tip: A sloped neckline usually increases the pattern’s accuracy, but flat necklines are also valid. Patterns with steep necklines can be tricky and might give misleading results, so it’s best to approach them with extra caution.
Trading on the Head and Shoulders pattern
Spotting the Head and Shoulders pattern is just the start; knowing how to trade it effectively is where the opportunity lies. Here’s a simple breakdown to help you turn observation into action.
Entry strategies
Breakout confirmation: Wait for a clear break through the neckline. Look for a decisive daily close below (or above if it’s an inverse pattern) the neckline. This is a key entry point for many traders.
Volume analysis: Watch for a spike in trading volume during the breakout. Higher volume validates the strength of the movement.
Retest approach: After breaking the neckline, the price often pulls back to test that level again. This retest can give you another opportunity to enter, with added confirmation of the move.
Calculating the Price Target
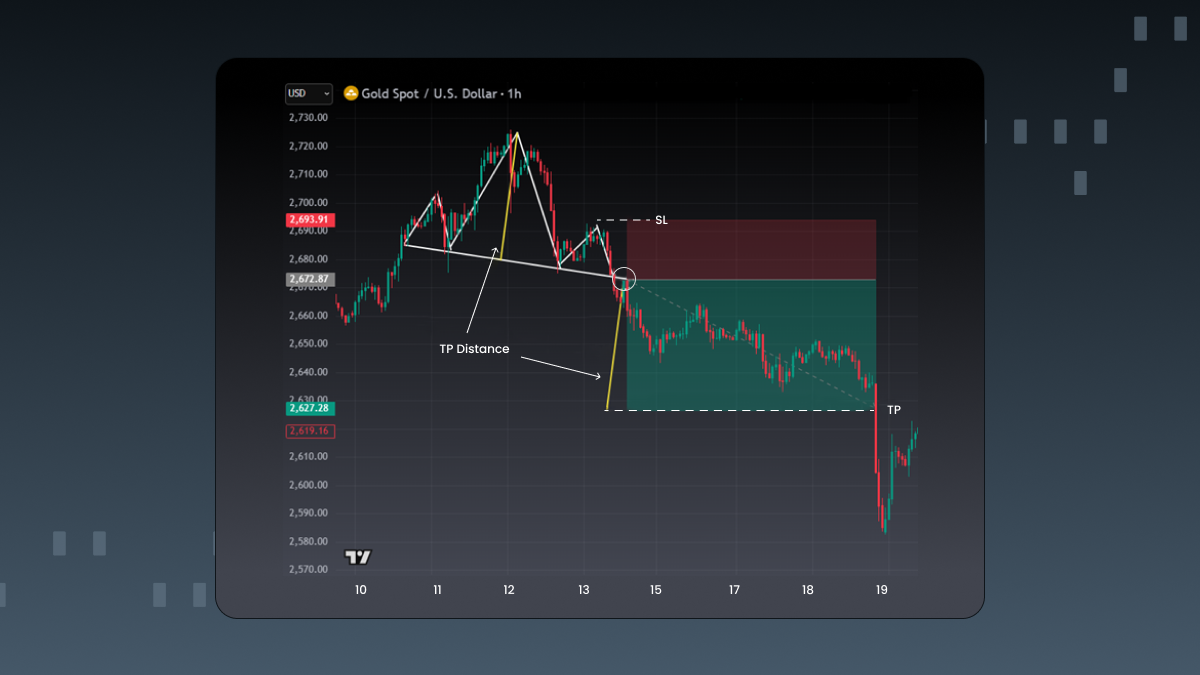
Calculating a price target doesn’t have to be complicated. Measure the distance from the top of the head to the neckline. For bearish patterns, take that distance and project it downward from the neckline. For bullish (inverse) patterns, do the same, but project upward.
Here’s an example to make things clear: if the head is at $50, the neckline is at $40, and the price breaks downward, your target would be $30 ($40 - $10).
By sticking to this approach, you can take the guesswork out of trading. Plan your entries, back it up with volume confirmation, and set realistic targets to stay ahead of the market.
Additional tip
When setting a price target, use Fibonacci retracement levels as potential checkpoints. This can help you identify intermediate zones of support or resistance while the price moves toward your target.
Risk Management
Now that we’ve reviewed price target calculation and entry strategies, it’s important to manage underlying risks. Here are a few key strategies to keep your trades safe and your losses in check.
Stop-loss placement: Set your stop-loss just above the right shoulder for regular patterns or just below it for inverse patterns. This helps protect your capital if the market doesn’t move as expected.
Position sizing: Don’t put too much of your funds at risk on one trade. Stick to risking only a small portion of your total capital to stay safe.
Avoid false breakouts: Double-check for confirmation before entering a trade. Low-volume conditions often lead to false signals, so wait for a clear daily close below the neckline to minimize the chances of getting caught in a fake move.
Example Trade
Imagine spotting a standard Head and Shoulders pattern in an uptrend, where the head is $100, the neckline is $90, and the right shoulder ends at $95. Once the price breaks below the neckline, the calculated target becomes $80.
After confirming the breakout with solid volume, you decide to short the asset. You set a stop-loss at $96 to limit your risk and aim for a target at $80. This setup offers a decent risk/reward ratio.
If you want to sharpen your strategy, backtest similar setups with historical data. It’ll help you see how the pattern behaves in various market conditions and boost your confidence in live trades.
Common mistakes to avoid
Even with a precise strategy, there are common errors traders should be cautious about:
Premature entries: Entering a trade before the pattern fully forms can lead to losses. Be patient and wait for a clear break of the neckline with confirmation.
Ignoring volume: Breakouts on low volume usually lack strength and can turn out to be false moves. Always check that volume backs the price action.
Drawing a bad neckline: If your neckline isn’t accurate enough, your trade setup can fall apart. Make sure it aligns with the price movement properly.
Relying only on the pattern: The Head and Shoulders pattern is reliable, but it shouldn’t be used alone. Make your analysis stronger by combining it with tools like Moving Averages or RSI.
Neglecting risk management: Forgetting to set a stop-loss can make your strategy vulnerable if the market is overly volatile.
Overleveraging: Setting excessively high leverage and failing to adjust targets for market volatility can turn good trades into major losses.
Avoiding these traps can significantly improve your trading results.
Summary
The Head and Shoulders pattern isn’t just another chart formation; it reveals the ins and outs of the market’s psychology. By learning its structure, spotting its signals, and trading carefully, you can take advantage of trend reversals with more confidence. Here’s how to make it work for you:
Use confirmation signals like volume and candlestick closes.
Stick to risk management techniques to protect your capital.
Be patient to avoid early or false entries.
There’s no such thing as the perfect pattern, but combining the Head and Shoulders with a thoroughly planned trading strategy can give you a big advantage in the market. If you want to sharpen your trading skills, start using this pattern in your analysis and aim for more calculated trades.
Whether you’re riding an inverse pattern upward or shorting a downtrend, the Head and Shoulders pattern can be your go-to tool for spotting and acting on market reversals.