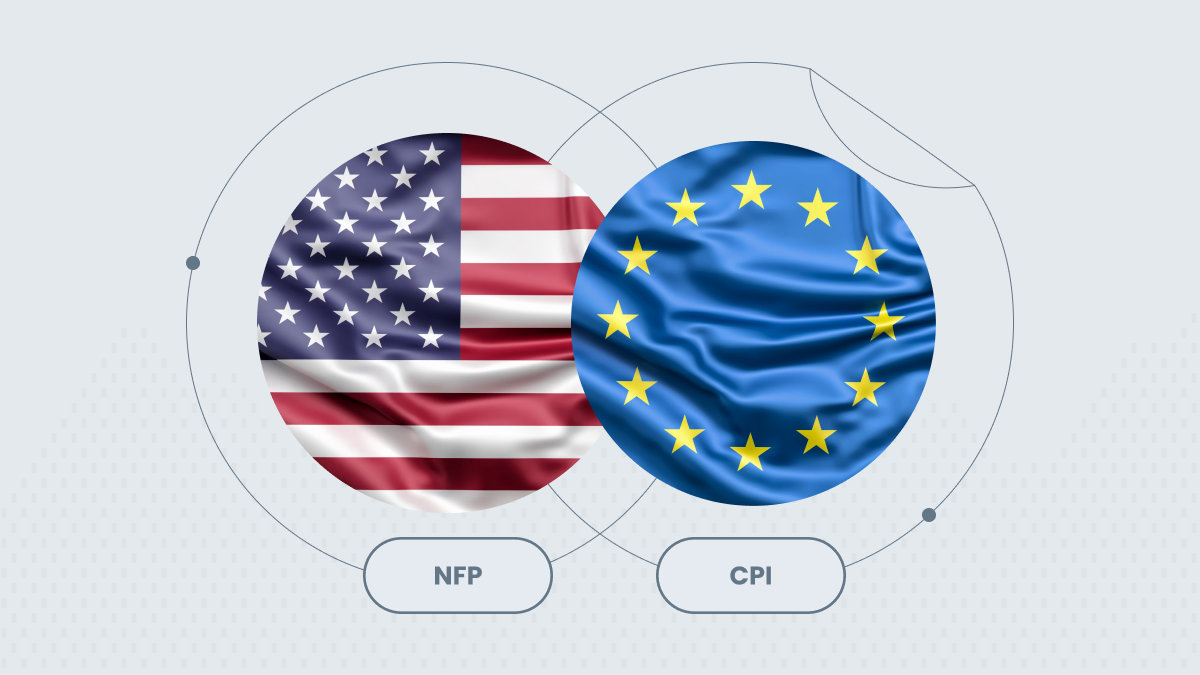
Unemployment Rate and Nonfarm Payrolls: Why They Are So Important for the Markets

Unemployment Rate and Nonfarm Payrolls: Why They Are So Important for the Markets

2023-09-07 • Updated

On the first Friday of every month, the US Department of Labor releases data on the employment rate and the number of people employed in non-agricultural sectors of the economy. Why is it so important?

First, high unemployment leads to social tensions, promoting the rise to power of radical politicians, and eventually potentially leading to unrest and a violent takeover of power.

Second, it is the effect of unemployment on production and, consequently, on economic growth (GDP growth).

Third, unemployment reduces the flow of taxes into the budget and increases government spending, including such things as unemployment benefits and social security payments.

In the United States, the unemployment rate is calculated with the number of people employed on nonfarm payrolls. This article will discuss how this calculation is done and what you must look for to analyze the unemployment rate.

The US unemployment rate

The unemployment rate is calculated through surveys of about 60,000 families by the Ministry of Labor. Both agricultural and nonagricultural workers are interviewed. A calculation is then made using the following simple formula:

Редизайн картинки для NFP_2560x400 (1).png

Economists agree that a normal unemployment rate is 4-5%. Since the end of the mortgage crisis, the unemployment rate in the US has continued to fall, and reached its historic low in February 2023 (3.4%).

1 (1).png

We should remember that the US Department of Labor only counts people actively looking for work as unemployed. People who cannot change their situation are not counted in the unemployment rate.

Nonfarm Payrolls

Nonfarm Payrolls (NFP) are also calculated through surveys. This time, however, 440,000 companies with more than 50 million workers are being surveyed. Thus, this metric measures by how much the number of people employed in companies increased or decreased.

What number of NFPs is considered "normal"? The general idea is the more, the better. More labor means stronger economic growth, which often leads to higher inflation. According to various estimates by economists, with normal development of the American economy (3-4% per year), the number of jobs created should be at least 150,000 per month.

If you pay attention to the NFP figure, you can see how badly the crisis years have affected employment results (the figure was negative).

2.png

What else is published along with the unemployment rate and NFP?

The US economy is very complex and rich in different statistics. Along with the unemployment rate and nonfarm payrolls, several other indicators should be paid attention to.

Leaving aside the calculation of different NFP indicators for other groups (e.g., NFP for government workers and NFP for the private sector), the most relevant indicators are average hourly earnings, average workweek, and the percentage of the economically active population.

The growth of average hourly earnings leads to an increase in consumer spending, which increases consumption and consequently, economic growth. Therefore, this indicator can significantly impact the market situation.

As the name implies, the Average Workweek measures how many hours workers work during a week on average. An increase in the average workweek is considered an indicator of economic growth, while a decline is likely to lead to corporate layoffs.

The share of the economically active population reflects the number of people who have or wish to have a source of livelihood. These are people between the ages of about 15 and 70, who may be both employed and unemployed.

Consequently, the growth of the economically active population is, of course, good for the economy.

What should I look for to determine the reliability of the NFP and unemployment forecast?

Even before the Unemployment Rate and Nonfarm Payrolls are released, a block of unemployment statistics is released in the US, affecting the consensus forecast. This article will explain what we need to pay attention to in order to understand if the consensus forecast is reasonable.

Number of initial jobless claims and number of secondary jobless claims (released every Thursday; data collected weekly)

Estimate: the higher the number of applications for unemployment benefits, the worse the employment situation is. Consequently, if the number of monthly applications increases, we should hardly expect a positive unemployment rate.

Challenger, Gray&Christmas Job cuts

Estimate: the more people are cut, the higher the unemployment rate. The connection is quite apparent. Unfortunately, however, it is tough to assess what number of people to be cut is normal and what number is above the norm. We suggest keeping an eye on the surge indicator. If there is a significant number of redundancies, we can say that the unemployment rate is unlikely to go down.

Conference Board Job Index

Estimate: the higher the index of job announcements, the lower the unemployment rate. It seems logical to track the indicator in dynamics. The fact is that the growth of the vacancy rate is not immediately reflected in the unemployment rate. The interview and hiring procedures take some time (one or two months).

ADP Nonfarm payrolls

Estimate: this is one of the most controversial indicators, which raises many questions. Before the nonfarm payroll figure is released, a preliminary assessment from Automatic Data Processing Inc. (ADP) is released the day before publication (Wednesday). The report is generated by evaluating about 340,000 companies and 21 million workers. Unfortunately, the data from the ADP report and the US Department of Labor often do not match up.

Conclusion

Knowing how to forecast Nonfarm Payrolls numbers will give you a powerful tool in your market analysis.

Try to trade on Nonfarm payrolls release with FBS.

Try your trading skills

Similar

How to find and trade a growth stock

FBS offers you selected stocks most of which are decades-proven titans. How to choose the best ones among them and what to do next? This article explains!

Frequently asked questions

  • How to start trading?

    If you are 18+ years old, you can join FBS and begin your FX journey. To trade, you need a brokerage account and sufficient knowledge on how assets behave in the financial markets. Start with studying the basics with our free educational materials and creating an FBS account. You may want to test the environment with virtual money with a Demo account. Once you are ready, enter the real market and trade to succeed.

  • How to open an FBS account?

    Click the 'Open account' button on our website and proceed to the Trader Area. Before you can start trading, pass a profile verification. Confirm your email and phone number, get your ID verified. This procedure guarantees the safety of your funds and identity. Once you are done with all the checks, go to the preferred trading platform, and start trading.

  • How to withdraw the money you earned with FBS?

    The procedure is very straightforward. Go to the Withdrawal page on the website or the Finances section of the FBS Trader Area and access Withdrawal. You can get the earned money via the same payment system that you used for depositing. In case you funded the account via various methods, withdraw your profit via the same methods in the ratio according to the deposited sums.

Deposit with your local payment systems

Data collection notice

FBS maintains a record of your data to run this website. By pressing the “Accept” button, you agree to our Privacy policy.

Callback

 1
 93
 355
 213
 1684
 376
 244
 1264
 672
 1268
 54
 374
 297
 61
 43
 994
 1242
 973
 880
 1246
 375
 32
 501
 229
 1441
 975
 591
 387
 267
 55
 246
 673
 359
 226
 257
 855
 237
 1
 238
 1345
 236
 235
 56
 86
 61
 61
 57
 269
 242
 243
 682
 506
 225
 385
 53
 357
 420
 45
 253
 1767
 1809
 593
 20
 503
 240
 291
 372
 251
 500
 298
 679
 358
 33
 594
 689
 241
 220
 995
 49
 233
 350
 30
 299
 1473
 590
 1671
 502
 224
 245
 592
 509
 39
 504
 852
 36
 354
 91
 62
 98
 964
 353
 44
 972
 39
 1876
 81
 962
 7
 254
 686
 850
 82
 965
 996
 856
 371
 961
 266
 231
 218
 423
 370
 352
 853
 389
 261
 265
 60
 960
 223
 356
 692
 596
 222
 230
 262
 52
 691
 373
 377
 976
 382
 1664
 212
 258
 95
 264
 674
 977
 31
 599
 687
 64
 505
 227
 234
 683
 672
 1670
 47
 968
 92
 680
 970
 507
 675
 595
 51
 63
 64
 48
 351
 1787
 974
 262
 40
 7
 250
 590
 290
 1869
 1758
 590
 508
 1784
 685
 378
 239
 966
 221
 381
 248
 232
 65
 421
 386
 677
 252
 27
 500
 34
 94
 249
 597
 268
 46
 41
 963
 886
 992
 255
 66
 670
 228
 690
 676
 1868
 216
 90
 993
 1649
 688
 256
 380
 971
 44
 1
 1
 598
 998
 678
 58
 84
 1284
 1
 681
 2
 967
 260
 263
00:00
00:00
00:00
01:00
02:00
03:00
04:00
05:00
06:00
07:00
08:00
09:00
10:00
11:00
12:00
13:00
14:00
15:00
16:00
17:00
18:00
19:00
20:00
21:00
22:00
23:00
23:00
23:00
00:00
01:00
02:00
03:00
04:00
05:00
06:00
07:00
08:00
09:00
10:00
11:00
12:00
13:00
14:00
15:00
16:00
17:00
18:00
19:00
20:00
21:00
22:00
23:00

A manager will call you shortly.

Change number

Your request is accepted.

A manager will call you shortly.

Next callback request for this phone number
will be available in

If you have an urgent issue please contact us via
Live chat

Internal error. Please try again later

Don’t waste your time – keep track of how NFP affects the US dollar and profit!

You are using an older version of your browser.

Update it to the latest version or try another one for a safer, more comfortable and productive trading experience.

Safari Chrome Firefox Opera