• Dec 25, 2024
  • Strategy

Types of Doji Candlestick Patterns a Trader Should Know

808914.jpg

The Doji candlestick pattern is a powerful technical analysis tool used in forex trading, stock trading, and other financial markets to signal uncertainty and potential reversals in the market. Although seemingly simple, the Doji is part of a complex and nuanced family of patterns that can provide critical insights into market movements alongside other indicators.

This article will explore various aspects of Doji candlesticks, types of Doji candles, their formation, and strategic trading implications that will enhance your understanding and improve your application of strategies in trading scenarios.

What is a Doji candlestick?

A Doji candlestick is a pivotal formation in chart analysis. It symbolizes indecision between buyers and sellers, where neither side gains significant ground. Visually, it is characterized by a very small or virtually nonexistent body and indicates that the opening and closing prices are almost identical. The lengths of the shadows can vary, but their presence shows that both bulls and bears were active during the trading period.

Other common candlestick patterns include the shooting star, morning and evening star, hammer, spinning top, and hanging man, among others. Each offers a glimpse into market sentiment and possible trend shifts or outcomes.

The importance of Doji patterns in trading

The significance of a Doji lies in its position within market trends. It often emerges at the top or bottom of a trend and suggests a potential reversal of price direction. However, if it appears during a consolidation phase of the market, it can also represent a continuation pattern.

This dual nature makes it an essential tool for traders who use it to gauge market sentiment and anticipate potential shifts in price direction.

Types of Doji candles

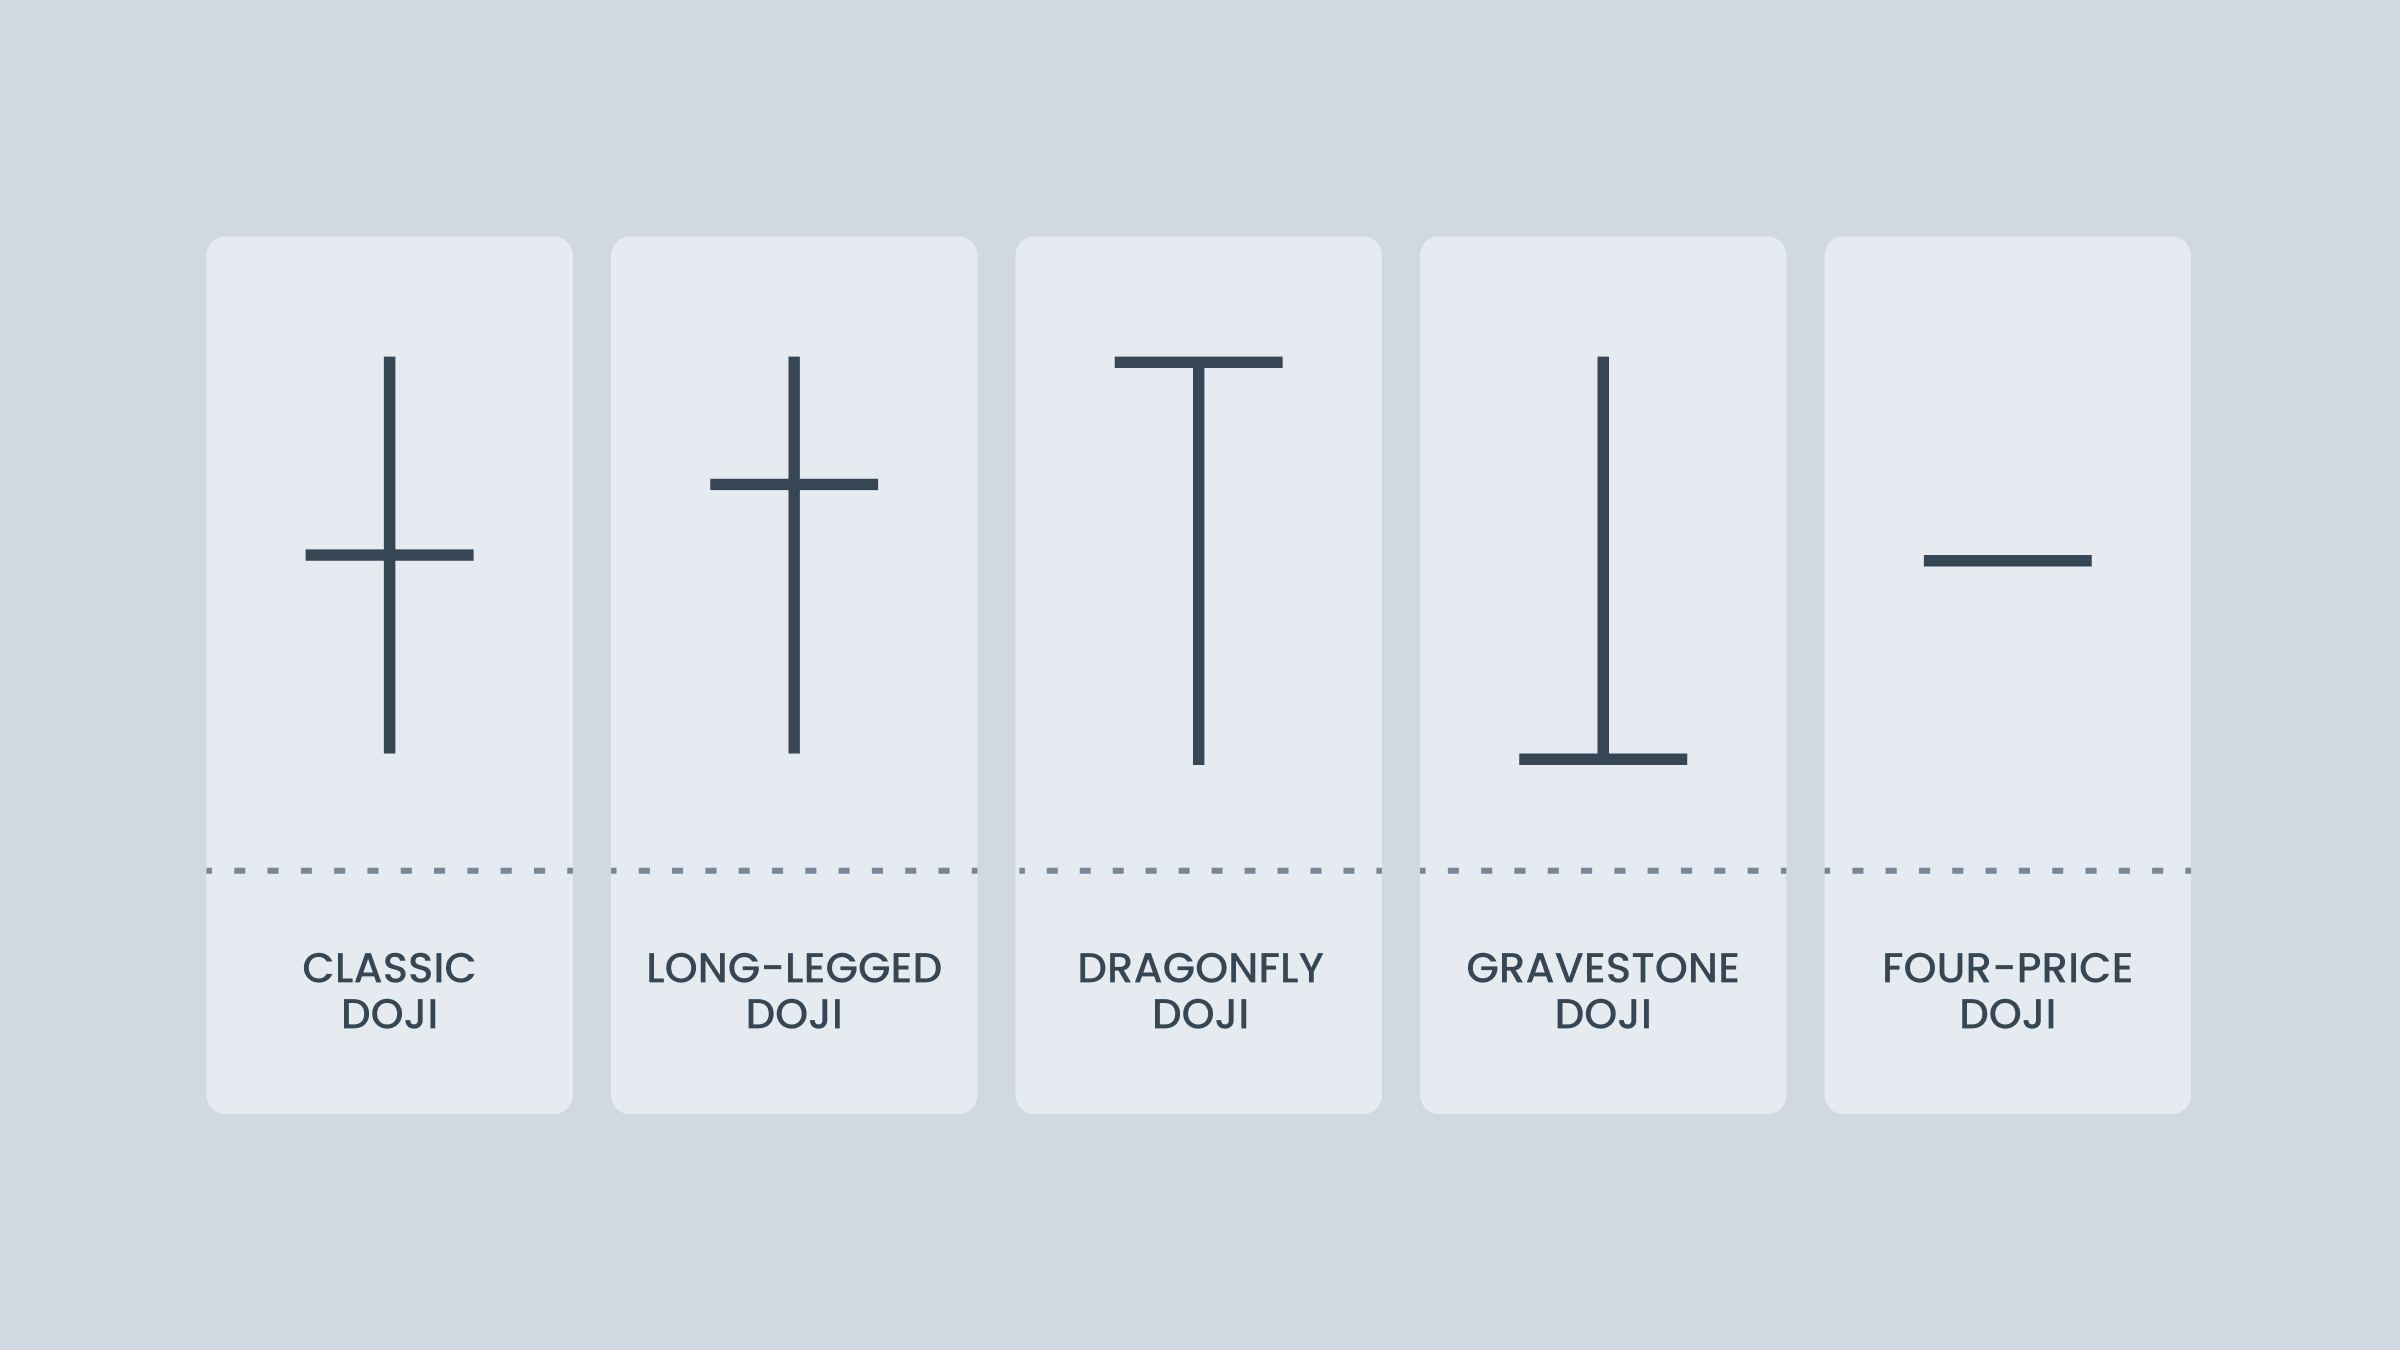
There are several distinct types of Doji candles, each providing unique insights into market conditions and the price trend. Understanding these variations is crucial for traders looking to refine their technical analysis and enhance their trading strategies.

1. Standard Doji

1.jpg

Standard Doji

Often called a "Common Doji," this pattern features a small body with shadows that are roughly equal in length, meaning a tight balance between buyers and sellers. It typically signals a period of consolidation before the market makes a more defined move.

Characteristics of a Standard Doji

A Standard Doji occurs when the price opens and closes at nearly the same level, which means there was no strong commitment from either side during that session.

Trading implications of a Standard Doji

The Standard Doji signals that market momentum is losing strength. This pattern indicates a possible market reversal or trend pause, but it does not provide a clear direction on its own. You should wait for a follow-up candle or confirmation from other indicators before deciding on a trade.

2. Gravestone Doji

2.jpg

Gravestone Doji

The Gravestone Doji candlestick is open, low, and close at the same level with a long upper shadow. This pattern suggests that buyers initially pushed prices higher, but sellers managed to bring it down to the opening level, often seen as a bearish reversal signal if it comes at the end of an uptrend.

Characteristics of a Gravestone Doji

The bearish Doji is a sign of uncertainty or market exhaustion, where the candlestick reflects that the bullish momentum has run out of steam. It also tends to occur in overbought conditions, where the market may be due for a correction.

Trading implications of a Gravestone Doji

The Gravestone Doji is one of the key trading signals to reassess long positions, particularly if it forms at the peak of a strong uptrend. The implications are amplified if this pattern is accompanied by higher volume. The confirmation of a bearish trend may be stronger if the next candlestick closes lower.

3. Dragonfly Doji

3.jpg

Dragonfly Doji

The Dragonfly Doji candlestick pattern occurs when the open, high, and close prices are at the same level, but there’s a significant tail below. It suggests that sellers drove the prices down during the session. Still, buyers were able to push it back up to opening level, indicating a potential bullish reversal if it occurs after a downtrend.

Characteristics of a Dragonfly Doji

Like a bullish Doji, it signals that the selling pressure might be exhausted. It forms in markets where volatility is high, yet the price does not significantly move above the opening level.

Trading implications of a Dragonfly Doji

When a Dragonfly Doji appears after a downtrend, it’s a potential signal to enter a long position, especially if it’s followed by bullish confirmation in the next candlestick. It’s essential to monitor the volume as well, because a higher volume after the pattern boosts its reliability as a reversal signal.

4. Long-legged Doji

4.jpg

Long-legged Doji

Known also as the "Rickshaw Man," the Long-legged Doji candlestick features long upper and lower shadows, which suggests extreme indecision as both bulls and bears attempt to control but end up nearly equal by the close. This type of Doji often appears after significant price movements and may signal a potential reversal or a considerable continuation of volatility.

Characteristics of a Long-legged Doji

Chart patterns like the Long-legged Doji emerge in both trending and range-bound markets and point to neither buyers nor sellers having gained clear dominance. It’s associated with high levels of market participation and found at points of market exhaustion.

Trading implications of a Long-legged Doji

Traders should avoid jumping into positions immediately, instead monitoring for any subsequent shifts in momentum. It could turn either way, so you should be aware of the surrounding market conditions, such as trend direction or consolidation.

5. Four-price Doji

5.jpg

Four-price Doji

This rare variation has open, close, high, and low prices simultaneously, showing an absolute balance and lack of volatility. It is a clear indecision pattern and can be seen in trading sessions with very low trading volume.

Characteristics of a Four-price Doji

The Four-price Doji is seen during periods of consolidation or at key turning points in the market. It indicates that no clear momentum has developed during the session.

Trading implications of a Four-price Doji

It’s important to be cautious because this pattern doesn’t give a clear signal on its own. It may turn out to be a reversal Doji candlestick, but the market could also continue in the same direction. Wait for further price movement or confirmation from other indicators before making a move.

How to trade using Doji candlestick patterns

6.jpg

Doji on a chart

A candlestick chart is a pivotal aspect of technical analysis, providing deep insights into market psychology and potential price movements. Beyond recognizing specific types of Doji candles, successful traders integrate these patterns into broader trading and investment strategies. Here’s how you can expand your trading acumen with candlestick patterns:

Access our app

Combine with technical indicators

To enhance the reliability of different types of Doji candles, traders should use them in conjunction with other technical indicators. For instance, volume indicators can validate the strength behind a Doji signal, while oscillators like RSI (relative strength index) or MACD (moving average convergence divergence) can help confirm trend reversals or continuations. Also, trend indicators such as moving averages or Bollinger bands provide context by identifying the broader market direction.

You can also use Doji patterns in conjunction with support and resistance levels to guide your entry points and exit strategies. For example, a Doji at support levels signals a bullish reversal, and a Doji at resistance levels indicates a bearish reversal.

Understand market context

The effectiveness of candlestick patterns varies by market condition and historical context. Patterns that form during high volatility or at key psychological price levels like support and resistance are often more significant.

Learn from experts and historical data

Whether you’re into swing trading, momentum trading, or another style, utilize resources such as trading courses, webinars, and historical data. They can improve your understanding of how candlestick patterns play out in different scenarios. Websites like TradingView and educational platforms offer extensive tools for analyzing past performance and testing strategies.

Practice with simulations

Before analyzing different types of Doji candles in live trading, practice them in a simulated environment. Many platforms offer demo accounts where you can trade virtual money while gaining real-time market experience.

Open a demo account

Stay informed on new developments

The financial markets, which include the stock and forex markets, constantly evolve, with new patterns and trading strategies emerging as market dynamics change. Staying informed through financial news, continuous education, and active trading communities, is crucial to adapting and optimizing candlestick trading methods.

Summary

The Doji candlestick, a symbol of market equilibrium, highlights moments of uncertainty where neither buyers nor sellers dominate. This pattern is a valuable tool for traders, signaling potential changes in price action and offering a chance to reassess strategies.

Traders can enhance their forex or stock market analysis by understanding the various types of Doji candles and incorporating them into a broader technical analysis framework. By recognizing the trading psychology behind the patterns and combining them with other indicators, traders can make more informed decisions and better manage their trades in the face of market indecision. It also works best when paired with strong risk management practices like controlling position sizes and avoiding over-leveraging as you handle uncertain market conditions.

FAQ

What are the different types of Doji candles?

There are five types of Doji candles. The Standard Doji shows market indecision with the open and close at the same price, the Gravestone Doji — a possible bearish reversal with a long upper shadow, the Dragonfly Doji — a potential bullish reversal with a long lower shadow, the Long-legged Doji — high uncertainty with long upper and lower shadows, and the Four-price Doji shows a total lack of volatilityand.

How can Doji patterns indicate market sentiment?

Doji patterns reveal market uncertainty, where neither buyers nor sellers dominate, and we might see changes in price direction. For example, the meaning of a red Doji candlestick is that sellers gained control during the session and there is potential bearish sentiment, or a reversal after an uptrend.

How do I read the Doji candle pattern?

The Doji candlestick pattern is a critical formation in technical analysis. It indicates market indecision where buying and selling pressures are balanced, leading to an unchanged price. This candlestick is characterized by its small or absent body, with wicks varying in length. Understanding this pattern is vital as it often precedes potential reversals in the market.

How do I use the different types of Doji candles for trading?

Using Doji candles for trading involves recognizing these patterns as part of larger trading strategies. A Doji occurs when a security’s open and close prices are virtually equal, symbolizing equilibrium between supply and demand.

Traders leverage this pattern by looking for confirmations of a trend reversal following a Doji. This could involve waiting for a subsequent candlestick to close in the opposite direction of the prior trend or using additional indicators like moving averages or RSI to enhance the reliability of the signal.

What is the psychology of Doji candle?

The psychology behind a Doji candlestick pattern centers on market indecision and the balance between buyers and sellers. In the context of pattern recognition, neither bulls nor bears can gain control, leading to a standoff. Typically, a Doji indicates a period of consolidation, where traders are unsure of the market’s direction, reflecting a significant struggle around a security’s value.

Register now

Share with friends: