
USDCHF: What Do the Fed and the SNB Say?
The USDCHF has been at the centre of attention following the monetary policy decisions of the Federal Reserve (Fed) and the Swiss National Bank (SNB). What can we expect now?
The Fed Holds Rates, but the Dot Plot Gives Clues...
Yesterday, the Fed kept rates unchanged at 4.25%-4.5%, citing economic uncertainty and inflation risks. Powell mentioned concerns about tariffs and immigration restrictions.
The Dot Plot showed that most FOMC members expect only two rate cuts in 2025. This suggests that the Fed intends to maintain control over inflation and avoid loosening too quickly.
The SNB Cuts Rates… and Could Keep Going
Meanwhile, the SNB surprised the market by reducing its interest rate by 25 basis points, bringing it to 0.25%, its lowest level since 2022. This is the fifth rate cut since 2024, signalling concerns over low inflation and economic risks.
Additionally, the SNB clarified that it is still ready to intervene in the forex market if necessary.
What Happens Next with USDCHF?
The divergence is clear: the Fed remains cautious with rate cuts, while the SNB continues to loosen its monetary policy. This could support USDCHF in the short term, although volatility will depend on upcoming macroeconomic data and market sentiment.
Will the dollar rebound, or will the Swiss franc resist? Stay tuned for the next moves!
Technical Analysis - USDCHF, H4
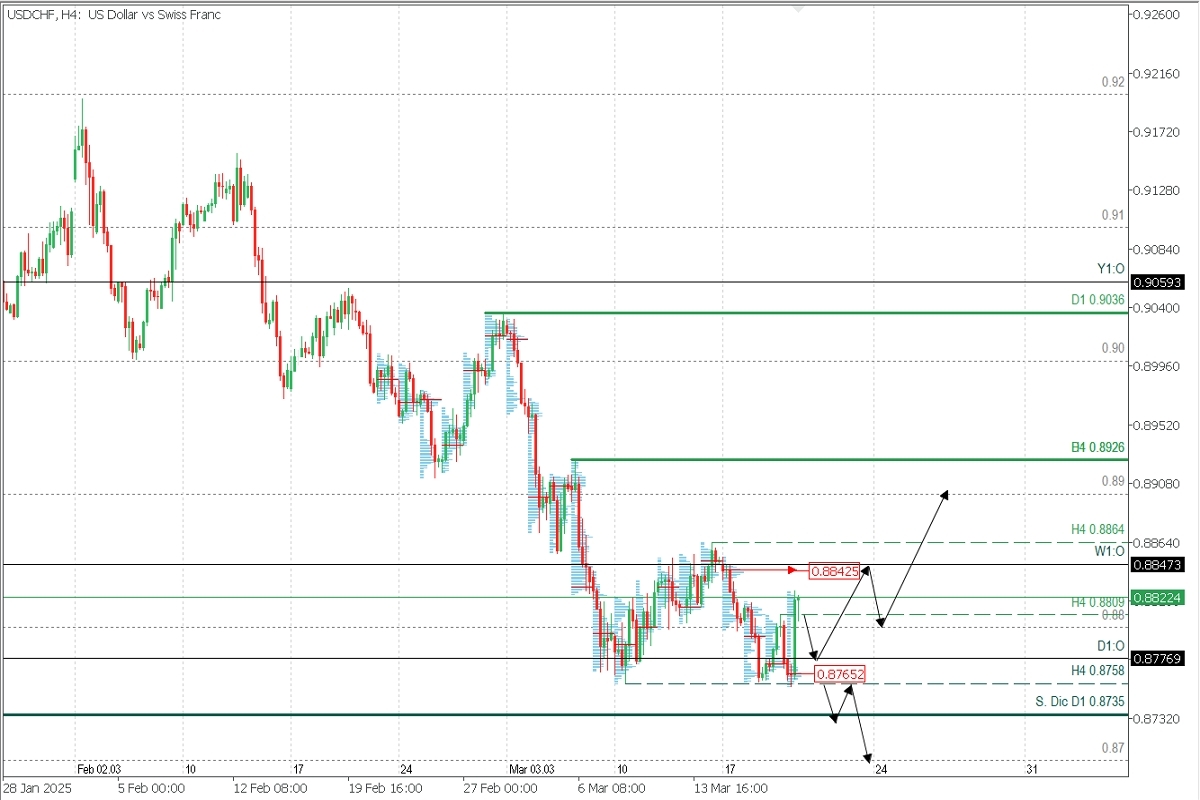
Supply Zones (Sell): 0.8842 // 0.89
Demand Zones (Buy): 0.8765
The recent SNB rate cut was the main driver of the price rally during the European morning, causing a breakout of the key H4 resistance at 0.8809, leaving a wide-range bullish candle with inefficiency (volume void) that the market typically corrects.
In this context, a pullback is expected to cover that area, seeking liquidity at the daily open (D1:O) 0.8776 and the Asian POC at 0.8765, demand zones (buy) that will likely be defended by bulls to trigger a new price rally towards the next supply zone at 0.8842, confirming the intraday bullish reversal. Only after breaking this level can we consider extending buys towards 0.89 and the next daily key resistance at 0.8926.
On the other hand, if the demand zone between 0.8776 and 0.8765 is decisively broken, the bullish trend will continue, as an increase in sell orders will likely lead to a break below December's support at 0.8735, extending the decline towards the psychological level at 0.87.
Technical Summary
Bearish Scenario: Sell below 0.8809 with targets at 0.8777 and 0.8765, where we could return to buy if an intraday bullish reversal pattern forms on M5. If this doesn’t occur, sales will continue towards 0.8735 and 0.87 in extension.
Bullish Scenario: Buy above 0.870 (waiting to form and confirm a reversal pattern on M5) with targets at 0.8842, 0.8864, and 0.89 in extension.
Exhaustion/Reversal Pattern (PAR): Before entering a trade in the key zones indicated, always wait for the formation and confirmation of a (PAR) on M5, as shown here 👉 Link
POC Discovered: POC = Point of Control: This is the level or zone where the highest volume concentration occurred. If a previous bearish move originated from it, it’s considered a sell zone and forms a resistance area. Conversely, if a bullish impulse previously occurred, it’s considered a buy zone, usually found at lows, forming support zones.


