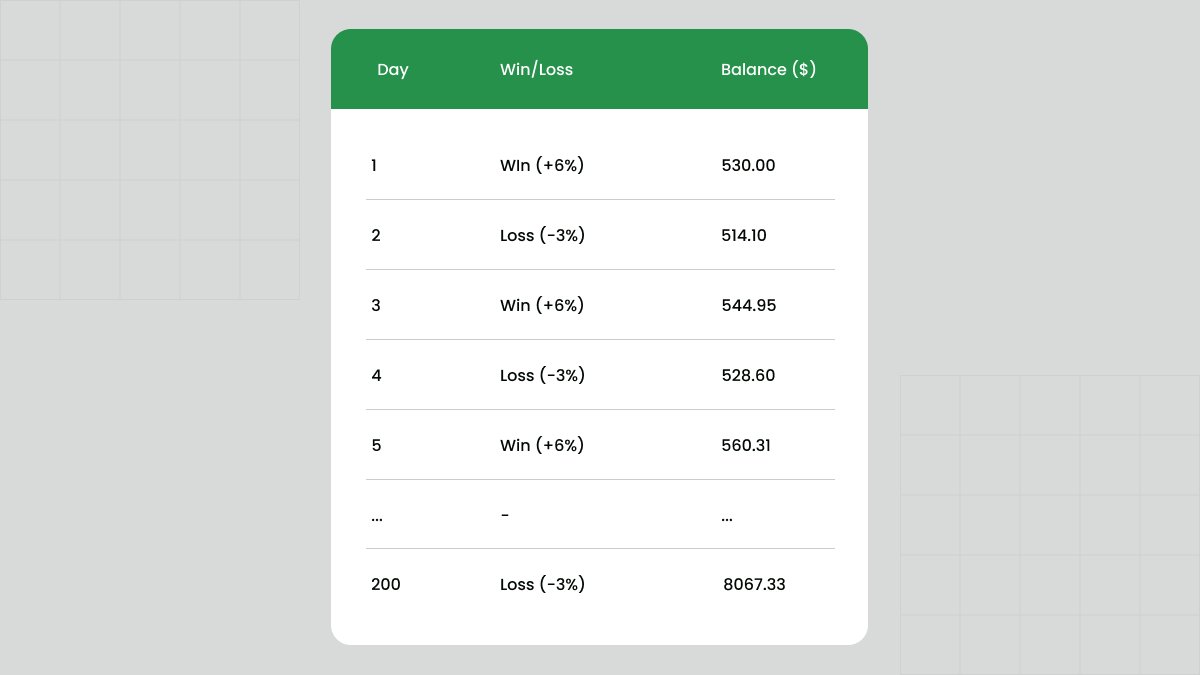
Strategy For Flat Trading: Rubber Band

Strategy For Flat Trading: Rubber Band

2023-04-03 • Updated

Although the market is flat 70% of the time, most of the trading strategies are for trend trading. Thus, most traders use only 30% of the trading potential! If you want to be more productive, pay attention to this strategy.

Prices can move in trends (up/down) or move sideways without any clear direction. This strategy applies to the second option – when the market is flat. Most of the success depends on how good a trader finds the entry and exit points. Sometimes, it’s really hard to define, that’s why traders use technical indicators and price patterns.

You will need the following indicators for this strategy:

How to recognize flat market?

There are two ways of doing that. It’s better to use a 4-hour timeframe (H4).

For beginners

Follow the signals of moving averages. If two moving averages are intersected or move in parallel, it’s a signal that the market is flat. It’s recommended to use 20- and 50-period moving averages for this purpose.

1.png

2.png

For intermediate traders

Define at least two price maximums on the same level and draw a horizontal line. Do the same with minimums. After that, you will get a horizontal corridor.

3.png

*Tip! Use both approaches and the signal will be stronger.

Setting indicators

  1. Open the H4.
  2. Insert two moving averages with periods of 20 and 50. Choose different colors for MAs.
  3. Open the H1.
  4. Insert Bollinger Bands with the default settings. The middle line of BB is the 20-period MA.
  5. Insert the Relative Strength Indicator (leave the period by default, change the levels to 35 and 65).

*Tip! Save the charts with the set indicators as a template. Further on you shouldn’t set these indicators and their settings again. To do that, click on any place of the chart with the right mouse button, then click ‘Templates’, then ‘Save Template’. Done!

When to open an order?

To open a BUY order, all the conditions below should be met.

  1. The market is flat in the 4-hour chart.
  2. Open the 1-hour timeframe (H1), wait for the price to break the lower line of Bollinger Bands and the RSI indicator to move below or approach the 35.00 level.
  3. (Optional) Open the 15-minute chart and find the signal for reversal. It could be a candlestick or price pattern. For example, a hammer or a double bottom. Besides, you can notice that the price bounces off the round number (0.8500, 0.8000).
  4. Open the BUY order!
  5. Place Stop Loss 20-30 points lower (= 2-3 pips) of the signal candle.
  6. Place Take Profit at the middle line of Bollinger Bands.

4.png

5.png

6.png

To open a SELL order, all the conditions below should be met.

  1. The market is flat in the 4-hour chart.
  2. Open the 1-hour timeframe (H1), wait for the price to break the upper line of Bollinger Bands and the RSI indicator to move above or approach the 65.00 level.
  3. (Optional) Open the 15-minute chart and find the signal for reversal. It could be a candlestick or price pattern. For example, a shooting star or a double top. Besides, you can notice that the price bounces off the round number (0.8500, 0.8000).
  4. Open the SELL order!
  5. Place Stop Loss 20-30 points higher (= 2-3 pips) of the signal candle.
  6. Place Take Profit at the middle line of Bollinger Bands.

This strategy suits both beginners and more advanced traders as on the one hand, it is based on simple indicators and on the other hand, requires several levels of filtration and confirmation of trade signals.

TRADE NOW

Similar

Frequently asked questions

  • How to start trading?

    If you are 18+ years old, you can join FBS and begin your FX journey. To trade, you need a brokerage account and sufficient knowledge on how assets behave in the financial markets. Start with studying the basics with our free educational materials and creating an FBS account. You may want to test the environment with virtual money with a Demo account. Once you are ready, enter the real market and trade to succeed.

  • How to open an FBS account?

    Click the 'Open account' button on our website and proceed to the Trader Area. Before you can start trading, pass a profile verification. Confirm your email and phone number, get your ID verified. This procedure guarantees the safety of your funds and identity. Once you are done with all the checks, go to the preferred trading platform, and start trading.

  • How to withdraw the money you earned with FBS?

    The procedure is very straightforward. Go to the Withdrawal page on the website or the Finances section of the FBS Trader Area and access Withdrawal. You can get the earned money via the same payment system that you used for depositing. In case you funded the account via various methods, withdraw your profit via the same methods in the ratio according to the deposited sums.

Deposit with your local payment systems

Data collection notice

FBS maintains a record of your data to run this website. By pressing the “Accept” button, you agree to our Privacy policy.

Callback

 1
 93
 355
 213
 1684
 376
 244
 1264
 672
 1268
 54
 374
 297
 61
 43
 994
 1242
 973
 880
 1246
 375
 32
 501
 229
 1441
 975
 591
 387
 267
 55
 246
 673
 359
 226
 257
 855
 237
 1
 238
 1345
 236
 235
 56
 86
 61
 61
 57
 269
 242
 243
 682
 506
 225
 385
 53
 357
 420
 45
 253
 1767
 1809
 593
 20
 503
 240
 291
 372
 251
 500
 298
 679
 358
 33
 594
 689
 241
 220
 995
 49
 233
 350
 30
 299
 1473
 590
 1671
 502
 224
 245
 592
 509
 39
 504
 852
 36
 354
 91
 62
 98
 964
 353
 44
 972
 39
 1876
 81
 962
 7
 254
 686
 850
 82
 965
 996
 856
 371
 961
 266
 231
 218
 423
 370
 352
 853
 389
 261
 265
 60
 960
 223
 356
 692
 596
 222
 230
 262
 52
 691
 373
 377
 976
 382
 1664
 212
 258
 95
 264
 674
 977
 31
 599
 687
 64
 505
 227
 234
 683
 672
 1670
 47
 968
 92
 680
 970
 507
 675
 595
 51
 63
 64
 48
 351
 1787
 974
 262
 40
 7
 250
 590
 290
 1869
 1758
 590
 508
 1784
 685
 378
 239
 966
 221
 381
 248
 232
 65
 421
 386
 677
 252
 27
 500
 34
 94
 249
 597
 268
 46
 41
 963
 886
 992
 255
 66
 670
 228
 690
 676
 1868
 216
 90
 993
 1649
 688
 256
 380
 971
 44
 1
 1
 598
 998
 678
 58
 84
 1284
 1
 681
 2
 967
 260
 263
00:00
00:00
00:00
01:00
02:00
03:00
04:00
05:00
06:00
07:00
08:00
09:00
10:00
11:00
12:00
13:00
14:00
15:00
16:00
17:00
18:00
19:00
20:00
21:00
22:00
23:00
23:00
23:00
00:00
01:00
02:00
03:00
04:00
05:00
06:00
07:00
08:00
09:00
10:00
11:00
12:00
13:00
14:00
15:00
16:00
17:00
18:00
19:00
20:00
21:00
22:00
23:00

A manager will call you shortly.

Change number

Your request is accepted.

A manager will call you shortly.

Next callback request for this phone number
will be available in

If you have an urgent issue please contact us via
Live chat

Internal error. Please try again later

Don’t waste your time – keep track of how NFP affects the US dollar and profit!

You are using an older version of your browser.

Update it to the latest version or try another one for a safer, more comfortable and productive trading experience.

Safari Chrome Firefox Opera