Asian stocks were mixed today, influenced by weak Chinese data and uncertainty around US Federal Reserve policies. Fed Chair Jerome Powell's cautious stance on cutting interest rates and stronger-than-expected US inflation data have reduced expectations for a December rate cut. This shift has strengthened the US Dollar and boosted Treasury yields. Traders are now closely watching US Retail Sales and Industrial Production reports for further clues on the economy and the Fed's next moves. The dollar rally remains supported by fewer anticipated rate cuts.
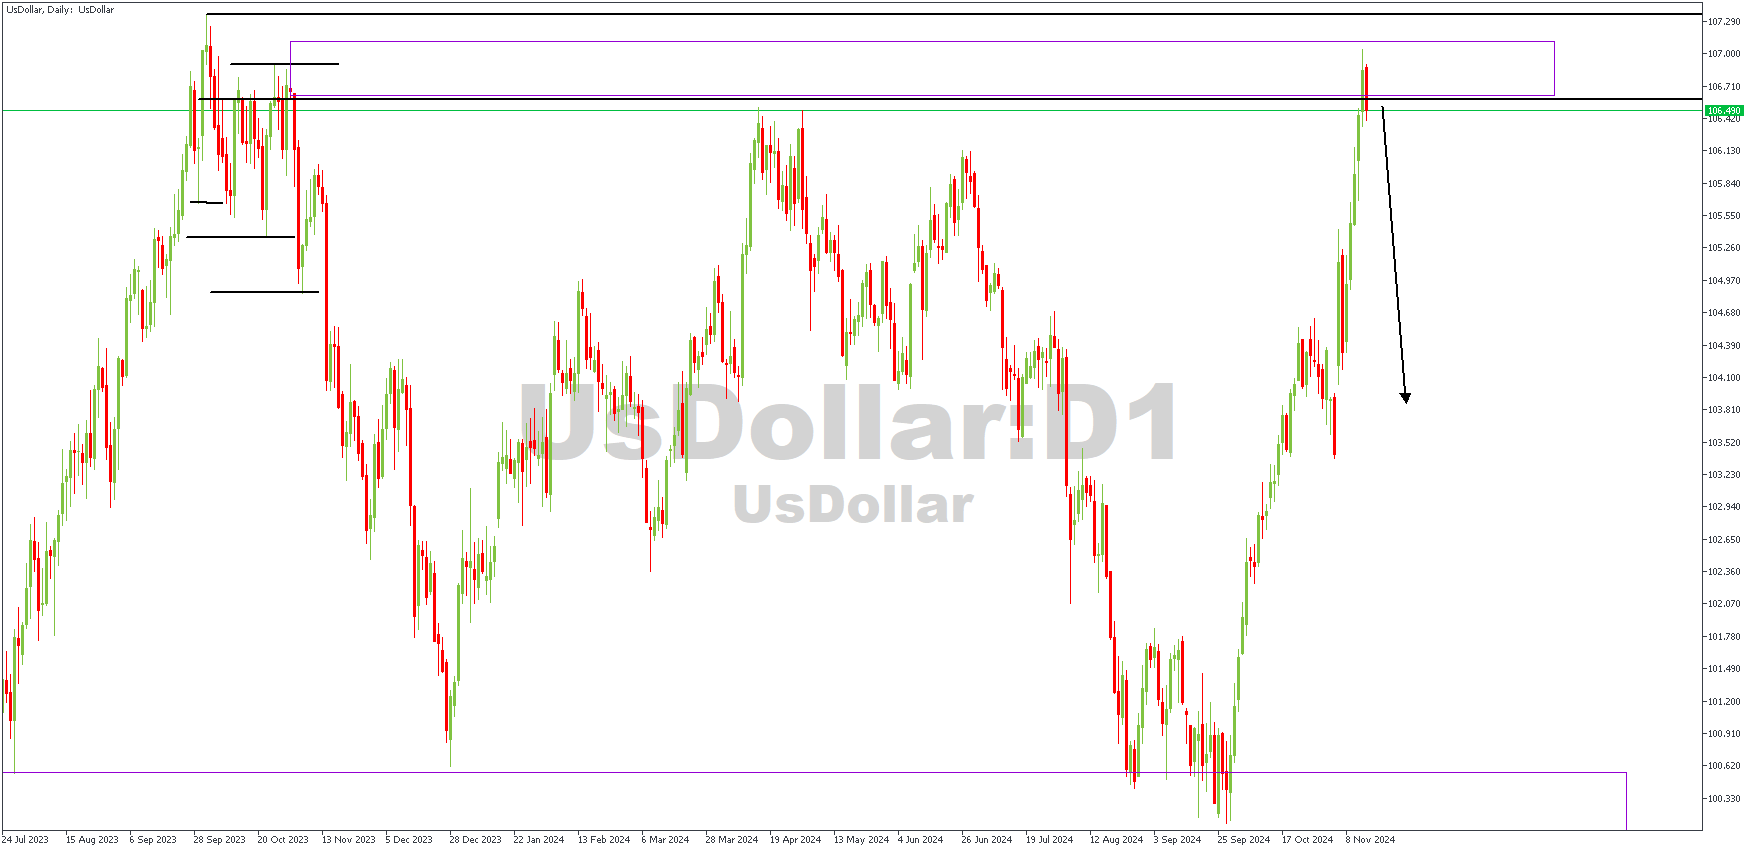
US DOLLAR – D1 Timeframe

On the daily timeframe, we see that the US Dollar has now reached a critical resistance region, as seen at the rally-base-drop supply zone. The price action on the daily timeframe has also created an SBR price action pattern, clearly pointing in favor of the US Dollar's bearish movement.
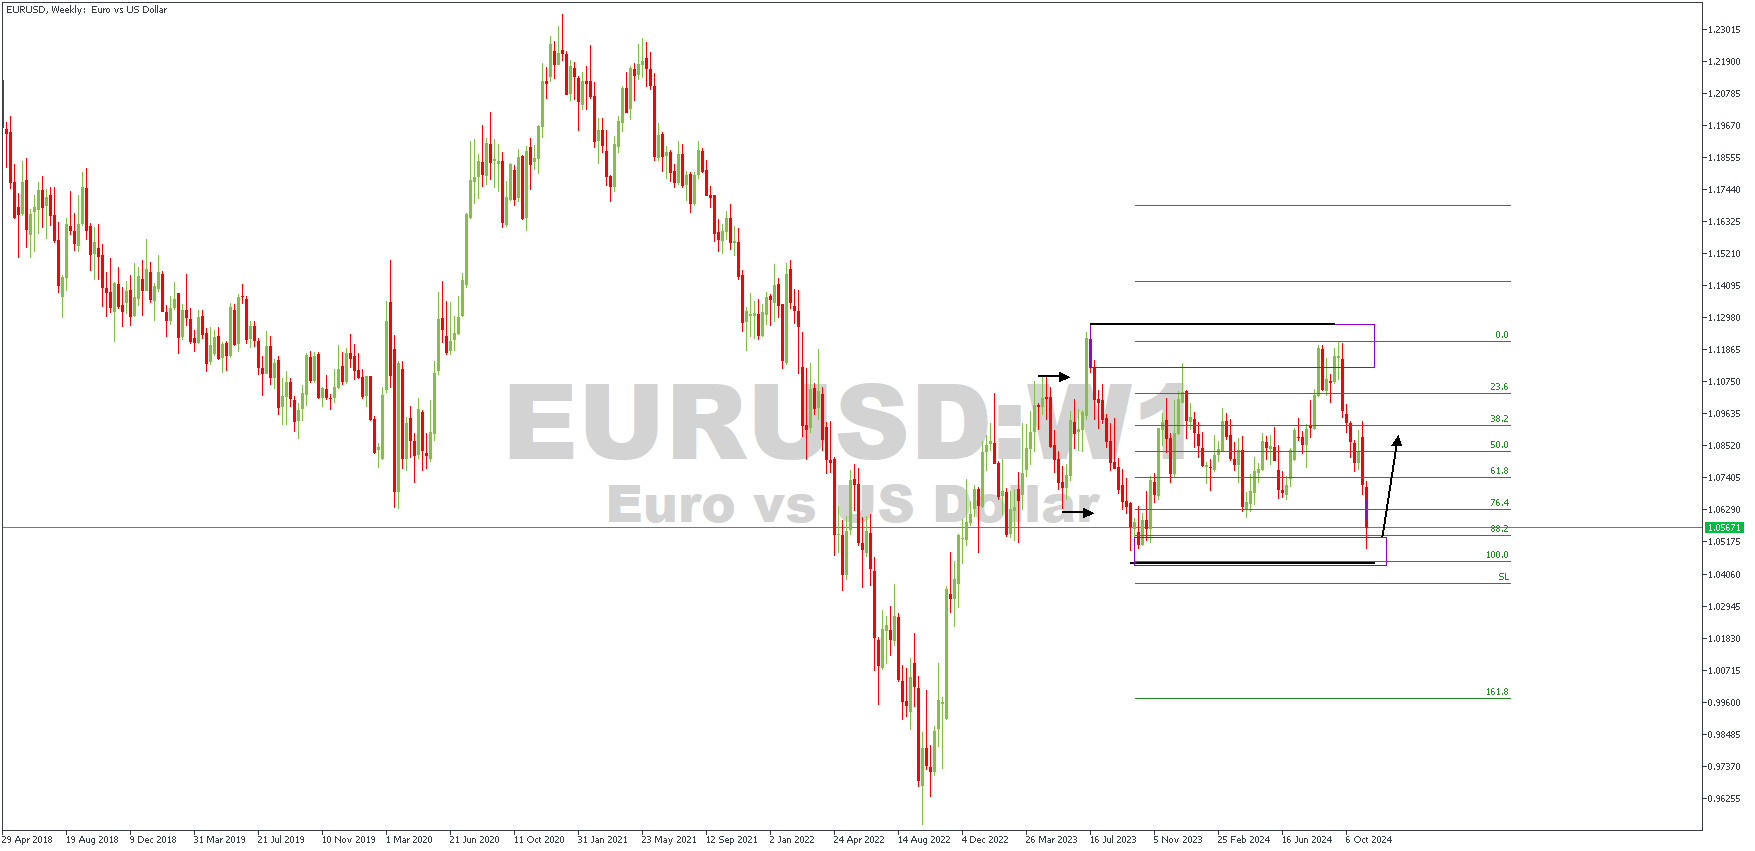
EURUSD – W1 Timeframe

The weakness of the US Dollar index is usually a key indicator of an impending bullish impulse on inversely correlated pairs. In the case of EURUSD on the weekly timeframe, we can see price reacting to the drop-base-rally demand zone at the 88% Fibonacci retracement level. The expectation here is that price will push a bit higher before it can find sufficient momentum to continue the bearish movement.
Analyst's Expectations:
Direction: Bullish
Target: 1.07627
Invalidation: 1.04183
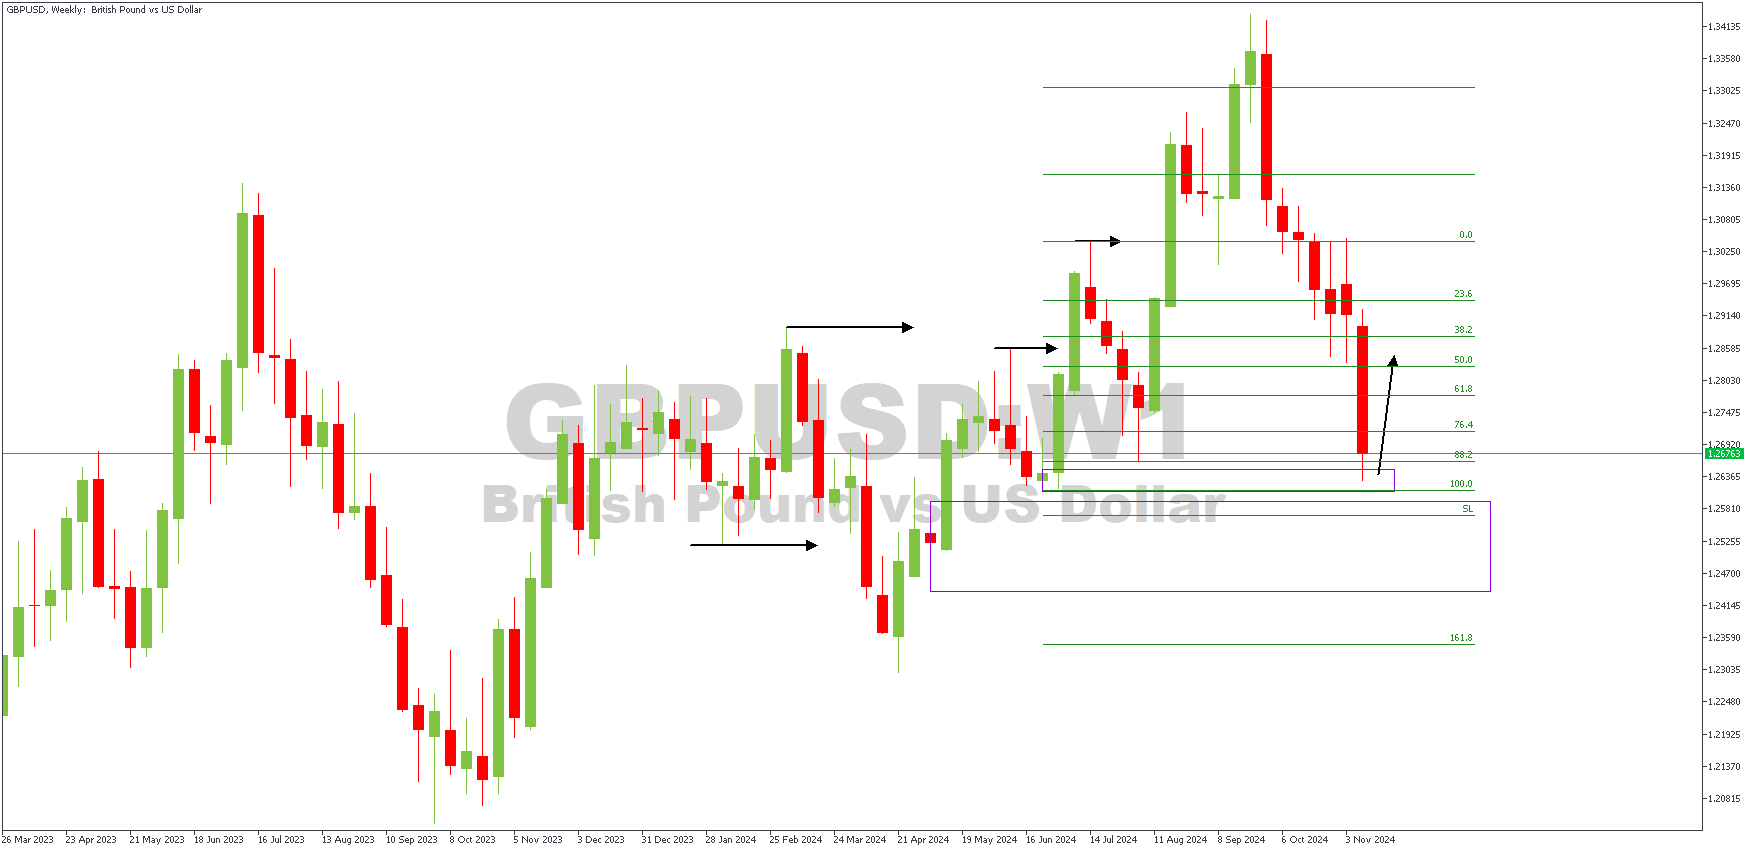
GBPUSD – W1 Timeframe

On the weekly timeframe of GBPUSD, we see the recent break above the previous high on the left-hand side of the chart. The subsequent retracement is also currently reacting to the demand zone responsible for the said BoS (break of structure). My expectation here is that we will see some bullish reaction from the demand zone before the price continues its bearish momentum.
Analyst's Expectations:
Direction: Bullish
Target: 1.28251
Invalidation: 1.26076
CONCLUSION
You can access more trade ideas and prompt market updates on the Telegram channel.


